Learn about Insights and the different visual and analytic tools available in the Finix Dashboard.
The Finix Dashboard has several charts and visual tools available to help provide an at-a-glance overview of key performance metrics for platforms and sellers.
- Use the date and column filters to breakdown your payment data.
- The data visualized updates as you change the filtered dates and columns.
The Home page is the first page you see when you log in to the Finix Dashboard and open your sandbox.
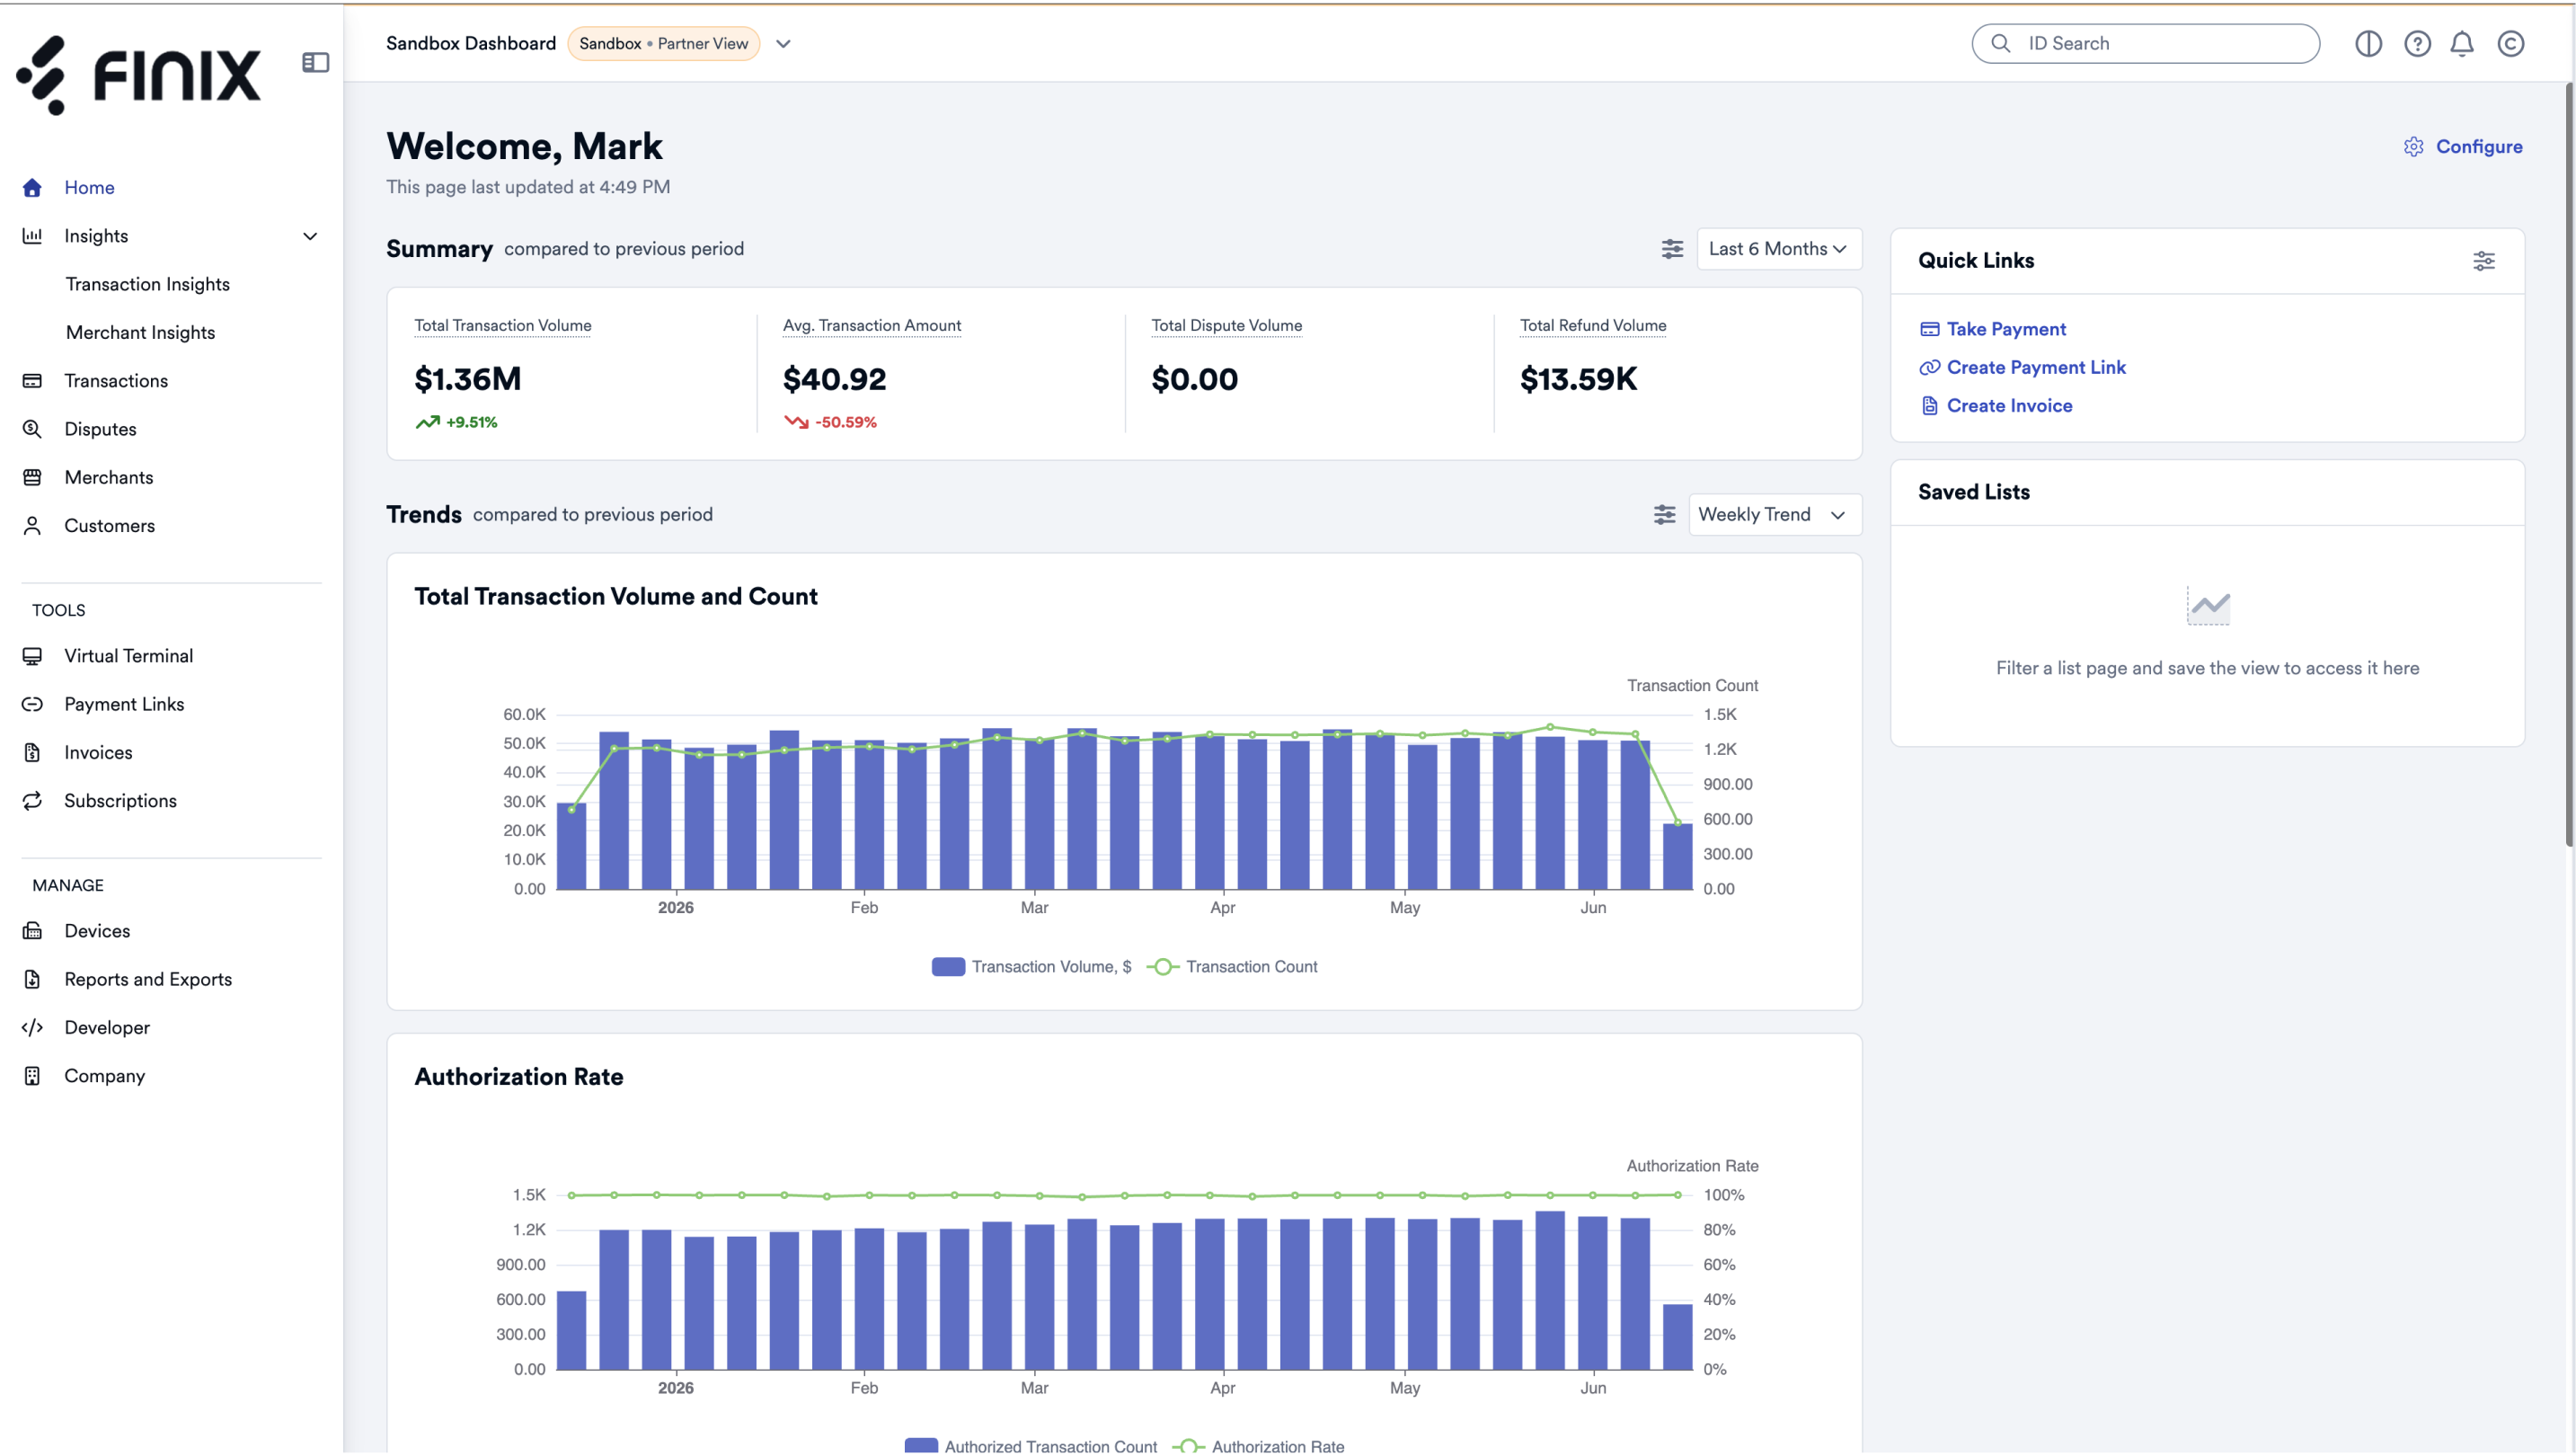
Analytics available on the Home page includes the following:
A snapshot of the payments processed.
| Analytic | Description |
|---|---|
| Total Transaction Volume | The total aggregate of all transactions, both Transfers and Authorizations. |
| Authorization Rate | Percentage of Transfers and Authorizations attempted that were successfully processed (doesn't include refunds). |
| Merchant Fees Collected | The total aggregate of all processing fees. |
| Avg. Transaction Amount | The average amount of transactions (both Transfers and Authorizations) processed across all Merchants. |
Detailed breakdown of the data provided in the Summary by Day, Month, or Year.
| Analytic | Description |
|---|---|
| Total Transaction Volume and Count | The total aggregate and count of all transactions, both Transfers and Authorizations. |
| Authorization Rate | Percentage of Transfers and Authorizations attempted that were successfully processed compared to the number attempted (doesn't include refunds). |
| Merchant Fees Collected | The total aggregate of all processing fees. |
| Average Transaction Amount | The average amount of transactions (both Transfers and Authorizations) processed across all Merchants. |
A breakdown of the payment data processed from the prior calendar month.
| Analytic | Description |
|---|---|
| Total Residual Amount | Total returned to the platform. |
| Avg. Interchange % | Average interchange charged per transaction. |
| Avg. Dues and Assessments % | Average amount of transactions that get paid as fees. |
| Card Payments | Total count of card payments processed. |
Payment data for the current calendar year.
| Analytic | Description |
|---|---|
| Active Merchants | Number of unique Merchants that are actively processing transactions. |
| Disputes | Number of Disputes filed by buyers against Merchants. |
| ACH Returns | Number of ACH transactions returned due to processing issues. |
| Chargeback Rate | Total percentage of Disputes submitted compared to the number transactions processed. |
The Transactions Insights page is available to help you dig deeper into the metrics of how your business processes payments.
To open the Transactions Insights page, click Insights > Transaction Insights.
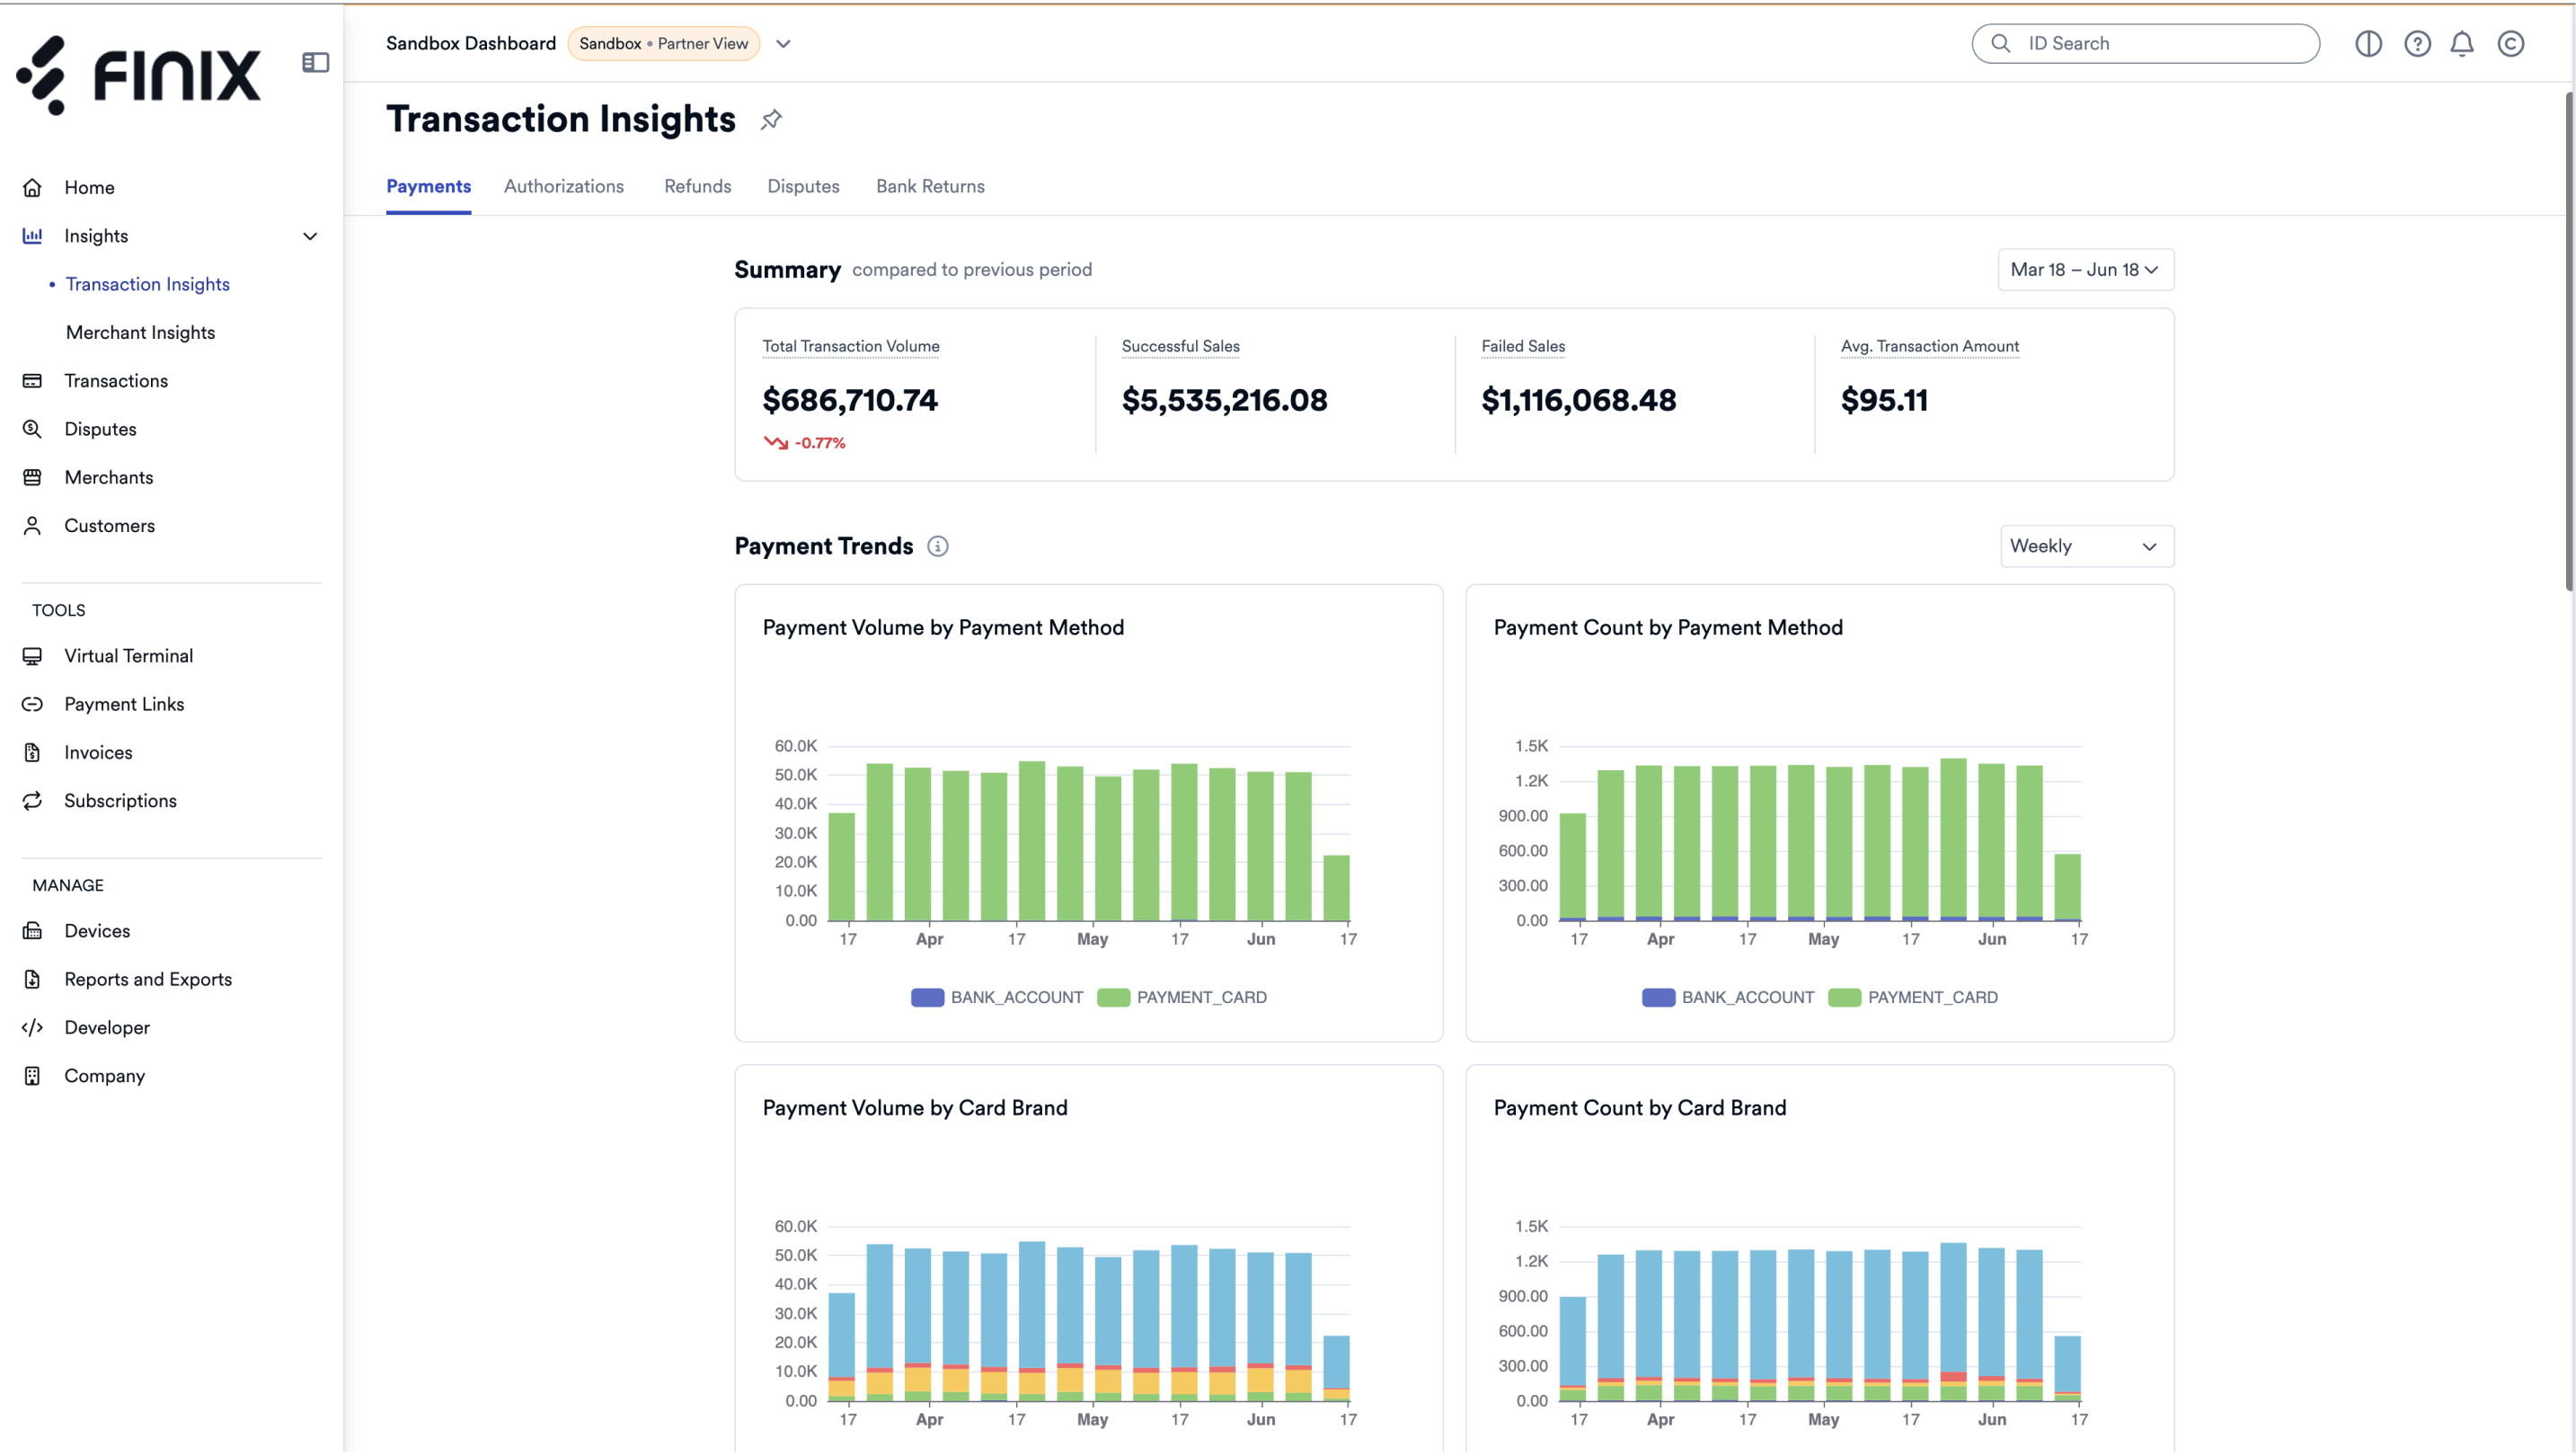
Analytics available on the Transaction Insights page includes the following:
A breakdown of the payments and transactions processed (both Transfers and Authorizations).
A snapshot of the payments processed.
| Analytic | Description |
|---|---|
| Total Transaction Vol. | The total aggregate of all transactions, both Transfers and Authorizations, for all of your Merchants. |
| Successful Sales | The total aggregate of all Transfers for all of your Merchants. |
| Failed Sales | The total aggregate of failed Transfers for all of your Merchants. |
| Avg. Transaction Amount | The average amount of transactions (both Transfers and Authorizations) processed across all Merchants. |
Break down payment method and card brand data by Day, Month, or Year.
| Analytic | Description |
|---|---|
| Payment Volume by Payment Method | Break down transaction volume by the different payment methods used by buyers. |
| Payment Count by Payment Method | Break down the number of transactions processed by the different payment methods used by buyers. |
| Payment Volume by Card Brand | Filter transaction volume by the different card brands used by buyers. |
| Payment Count by Card Brand | Filter the number of transactions processed by the different card brands used by buyers. |
Transaction data broken down across all Merchants.
Available for platforms only, for more details, see Platform Payments.
Filter the payment data you've processed by:
- Card Brand
- Card Type
- Card Issuer Country
- Payment Channel
A detailed breakdown of failed transactions by the failure code that was returned.
A breakdown of the Authorizations processed.
A snapshot of the Authorizations processed.
| Analytic | Description |
|---|---|
| Requests Received | The total aggregate of all transactions, both Transfers and Authorizations. |
| Authorization Rate | Total percentage of successful Authorizations compared to the number attempted (doesn't include refunds). |
| Voided Authorizations | The total aggregate of voided Authorizations. |
| Captured Authorizations | The total aggregate of successfully captured Authorizations. |
Break down approved Authorizations and card brand data by Day, Month, or Year.
| Analytic | Description |
|---|---|
| Authorization Rate by Card Brand | Total percentage of successful Authorizations broken down by the card brand used by buyers. |
| Authorization Count by Card Brand | Total count of successful Authorizations broken down by the card brand used by buyers. |
Authorization data broken down across all Merchants.
Available for platforms only, for more details, see Platform Payments.
Authorization data broken down across all Merchants.
Available for platforms only, for more details, see Platform Payments.
A detailed breakdown of failed Authorizations by the failure code that was returned.
A breakdown of the refunds processed.
A snapshot of the refunds processed.
| Analytic | Description |
|---|---|
| Gross Processing Vol. | The total aggregate of all transactions, both Transfers and Authorizations minus the total aggregate of refunds processed. |
| Successful Refunds | The total aggregate of successfully processed refunds. |
| Failed Refunds | The total aggregate of failed refunds. |
| Total Transaction Vol. | The total aggregate of all transaction volume. |
Break down refund, payment method, and card brand data by Day, Month, or Year.
| Analytic | Description |
|---|---|
| Refund Volume by Payment Method | Total aggregate of successful refunds broken down by the payment method used by buyers. |
| Refund Count by Payment Method | Total count of refunds broken down by the payment method used by buyers. |
| Refund Volume by Card Brand | Total aggregate of successful refunds broken down by the card brand used by buyers. |
| Refund Count by Card Brand | Total count of refunds broken down by the card brand used by buyers. |
Data surrounding the refunds processed broken down across all Merchants.
Available for platforms only, for more details, see Platform Payments.
Data surrounding refunded card transactions broken down by the card brands used by buyers.
The Merchant Insights page provides an overview of merchant onboarding activity, transaction performance, and geographic distribution.
To open the Merchant Insights page, click Insights > Merchant Insights.
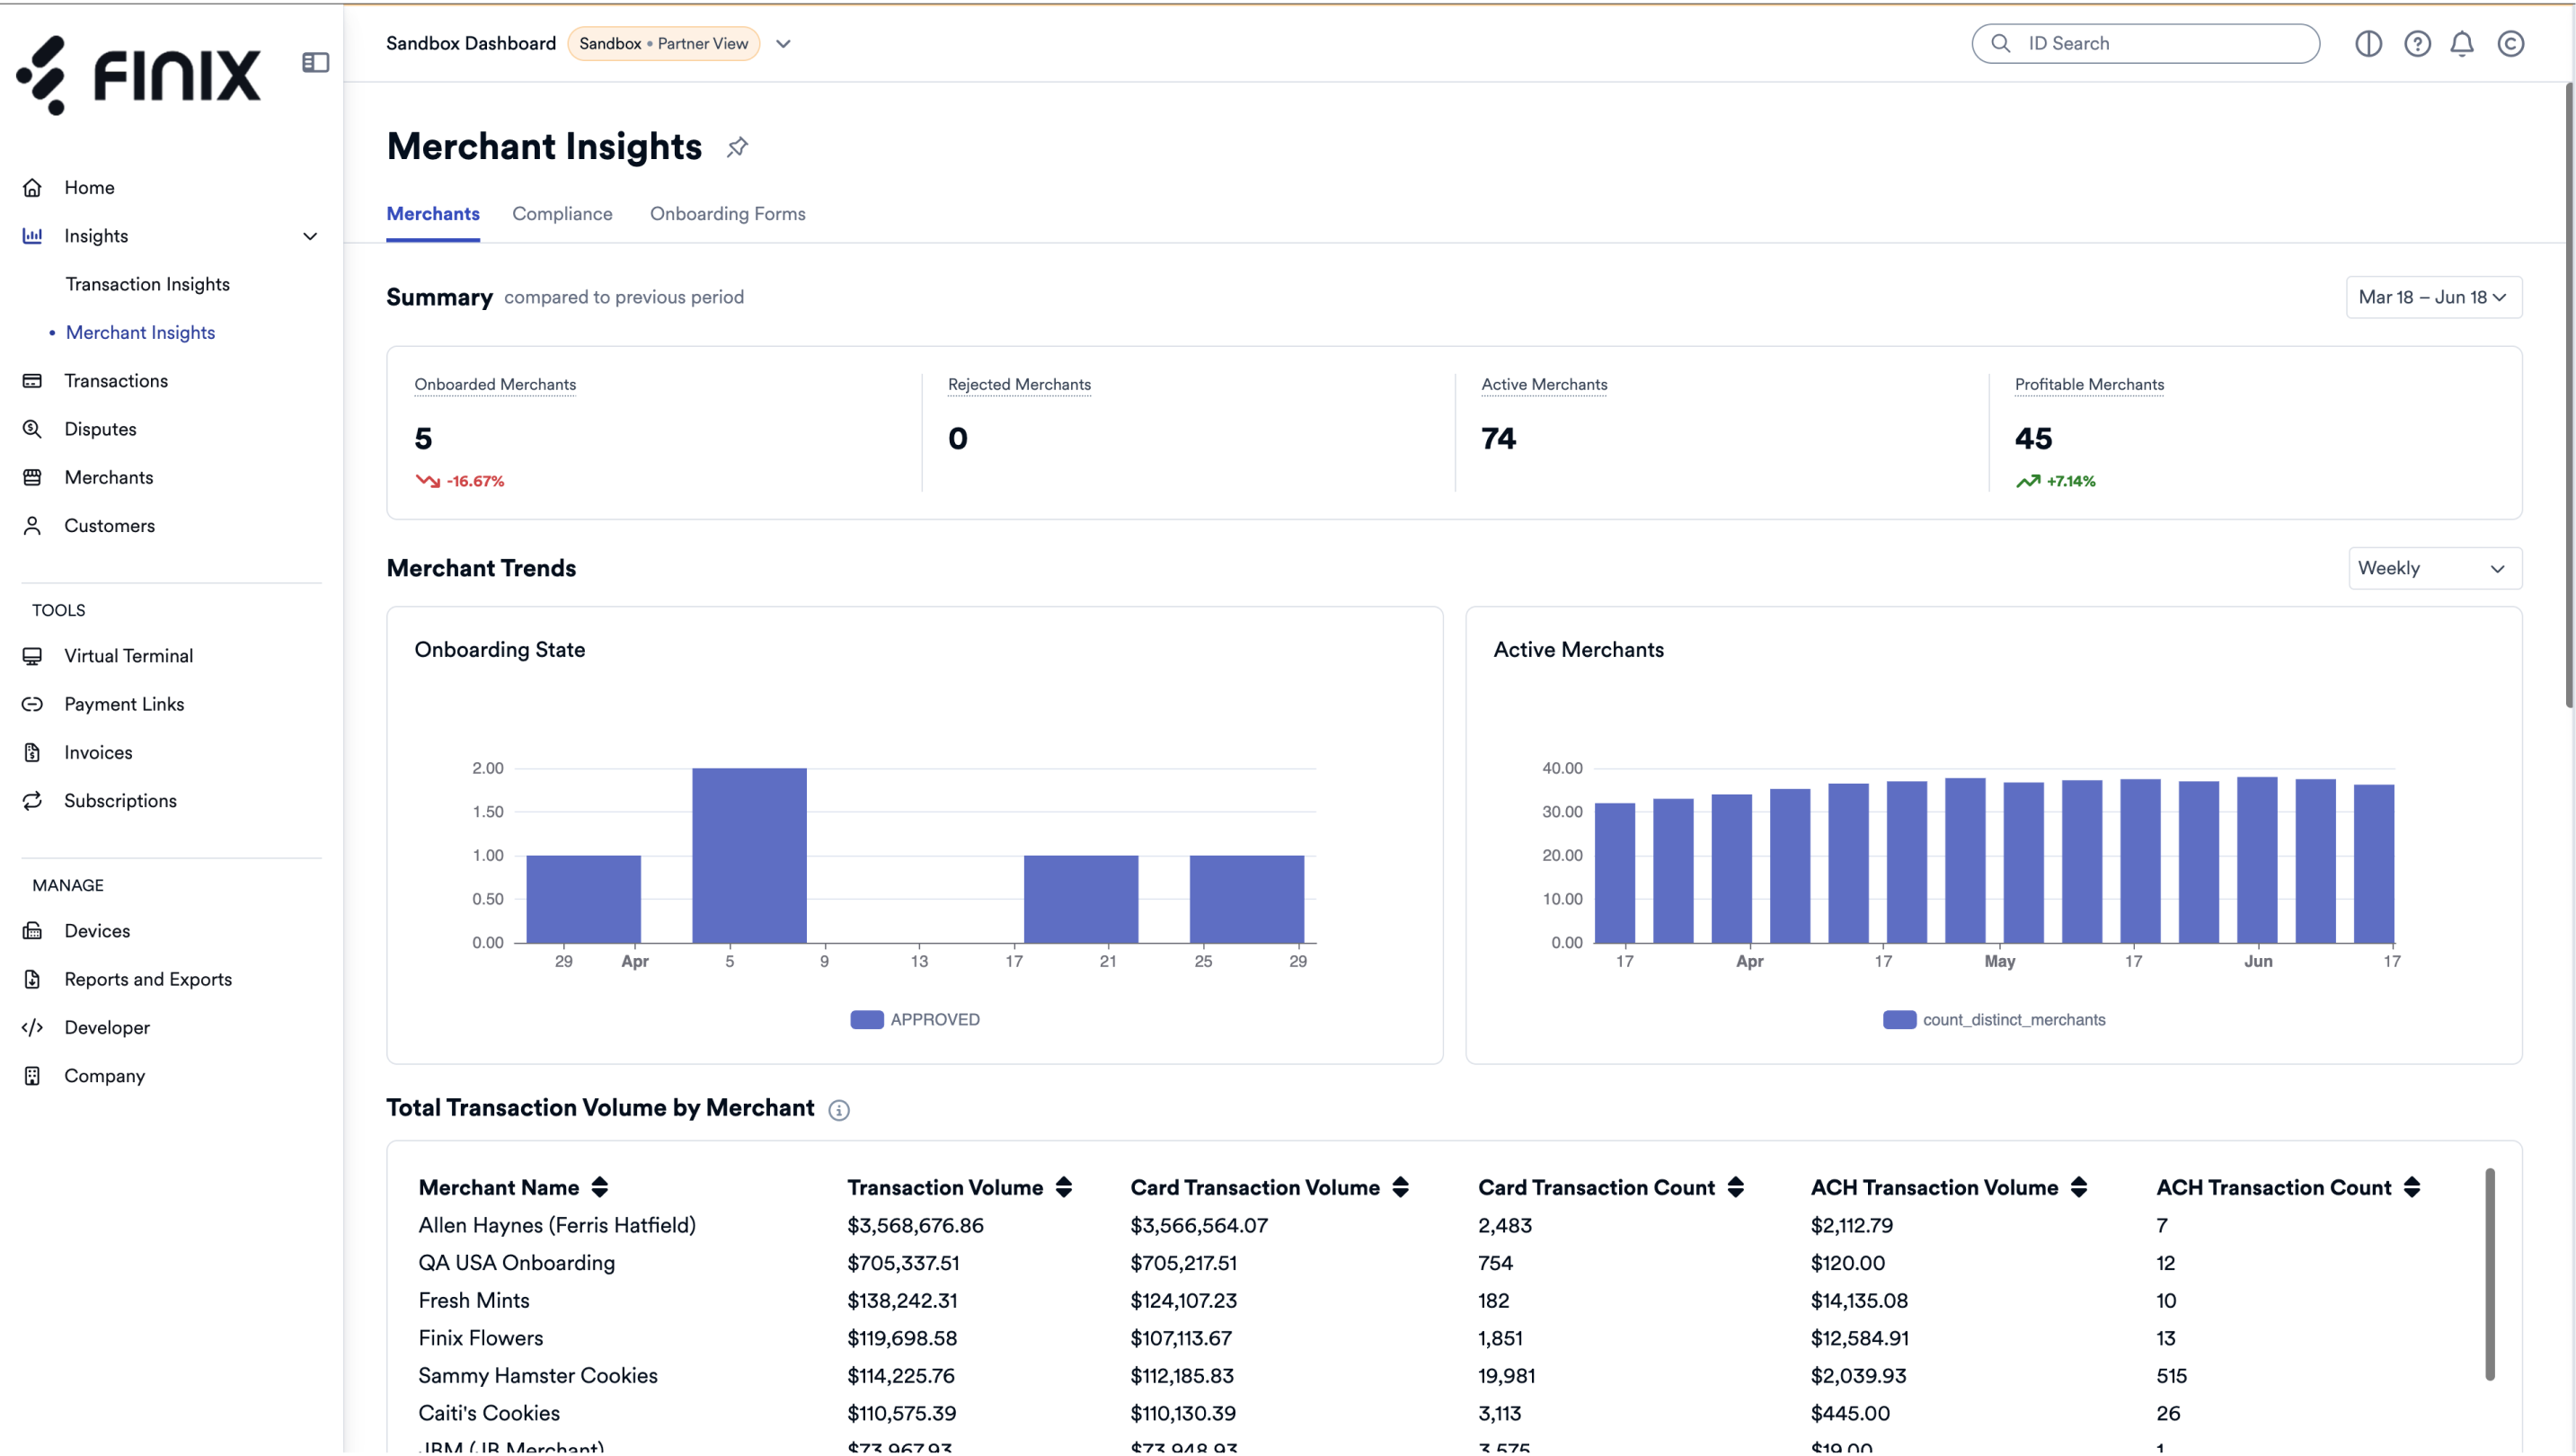
Analytics available on the Merchant Insights page includes the following:
A snapshot of merchant activity compared to the previous period.
| Analytic | Description |
|---|---|
| Onboarded Merchants | The total number of new Merchants onboarded during the selected period. |
| Rejected Merchants | The total number of Merchants rejected during the selected period. |
| Active Merchants | The total number of Merchants actively processing transactions. |
| Profitable Merchants | The total number of Merchants that were profitable during the selected period. |
Break down merchant onboarding and activity data by Week.
| Analytic | Description |
|---|---|
| Onboarding State | A breakdown of Merchants by their current onboarding state over the selected period. |
| Active Merchants | The number of Merchants actively processing transactions over the selected period. |
A detailed breakdown of transaction volume across all Merchants.
| Column | Description |
|---|---|
| Merchant Name | The name of the Merchant. |
| Transaction Volume | The total aggregate of all transactions processed by the Merchant. |
| Card Transaction Volume | The total aggregate of card transactions processed by the Merchant. |
| Card Transaction Count | The total number of card transactions processed by the Merchant. |
| ACH Transaction Volume | The total aggregate of ACH transactions processed by the Merchant. |
| ACH Transaction Count | The total number of ACH transactions processed by the Merchant. |
A breakdown of transaction volume grouped by Merchant Category Code (MCC).
| Column | Description |
|---|---|
| MCC | The four-digit Merchant Category Code assigned to the Merchant. |
| MCC Description | The category of goods or services associated with the MCC. |
| Total Transaction Volume | The total aggregate of all transactions for Merchants under the MCC. |
| Card Transaction Volume | The total aggregate of card transactions for Merchants under the MCC. |
| Card Transaction Count | The total number of card transactions for Merchants under the MCC. |
| ACH Transaction Volume | The total aggregate of ACH transactions for Merchants under the MCC. |
| ACH Transaction Count | The total number of ACH transactions for Merchants under the MCC. |
A breakdown of merchant activity and transaction volume by state or province.
| Column | Description |
|---|---|
| State | The state or province where the Merchant is located. |
| Active Merchants | The number of Merchants actively processing transactions in that location. |
| Transaction Volume | The total aggregate of all transactions for Merchants in that location. |
| Card Transaction Volume | The total aggregate of card transactions for Merchants in that location. |
| Card Transaction Count | The total number of card transactions for Merchants in that location. |
| ACH Transaction Volume | The total aggregate of ACH transactions for Merchants in that location. |
| ACH Transaction Count | The total number of ACH transactions for Merchants in that location. |
At this time, Insights is available for:
- Finix Flex customers
- Customers using
FINIX_V1as a processor
If you have any questions about availability or using Insights, please reach out to the Finix Support Team.